Plot Descriptor
This section demonstrates how to use NepTrainKit to segment descriptors and plot the structural distribution.
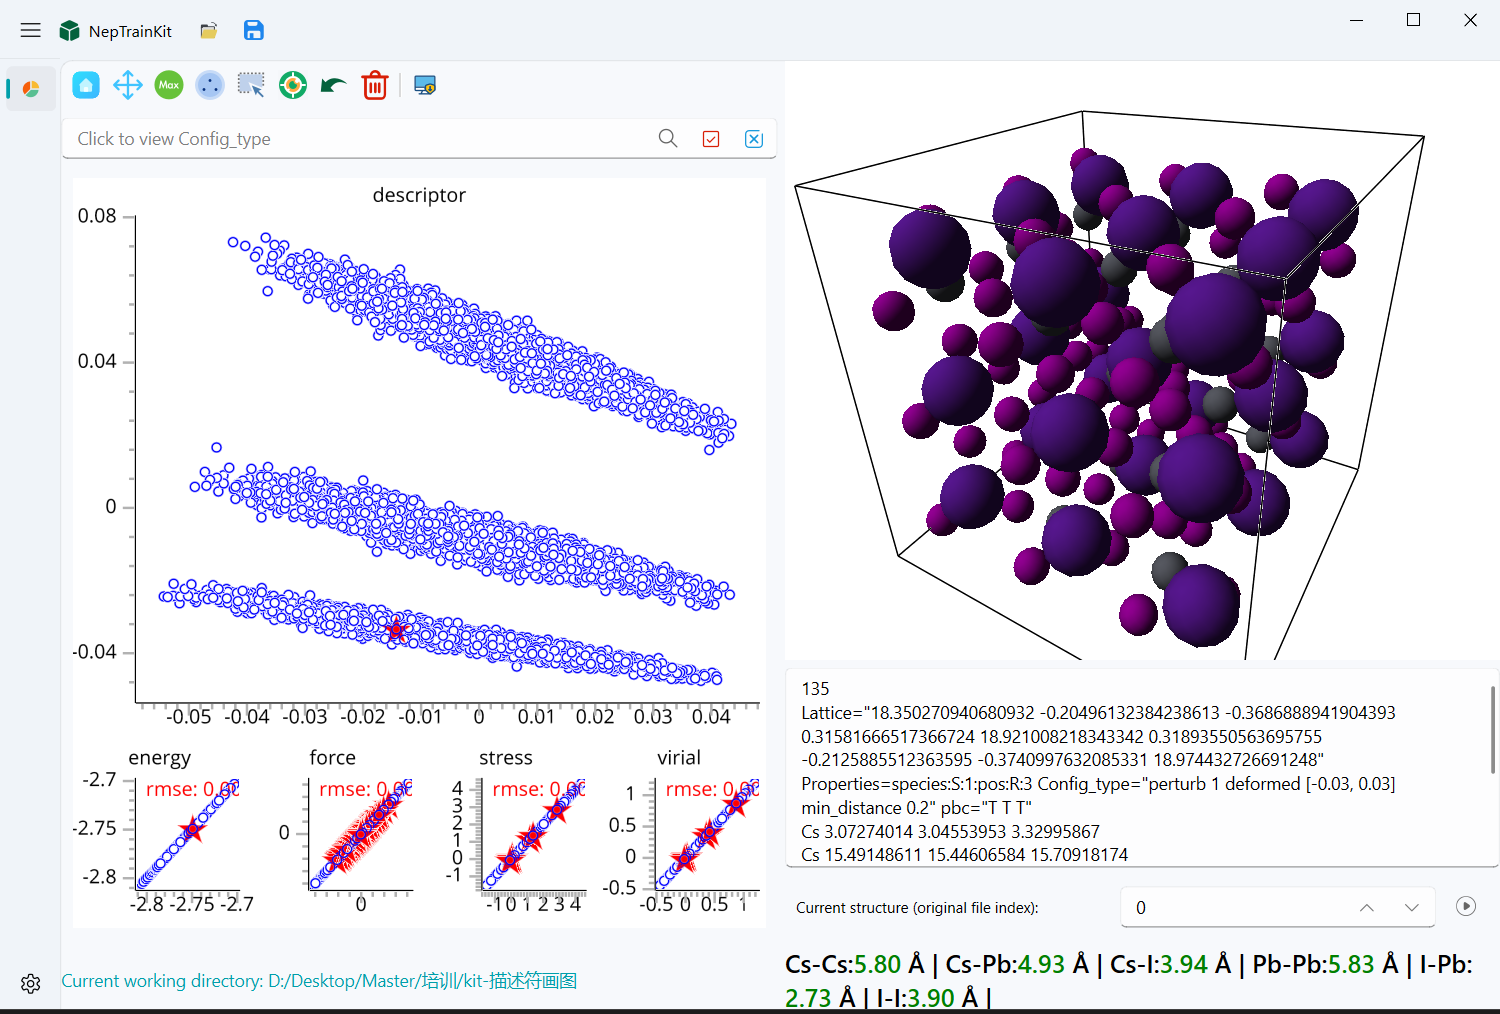
Data Import
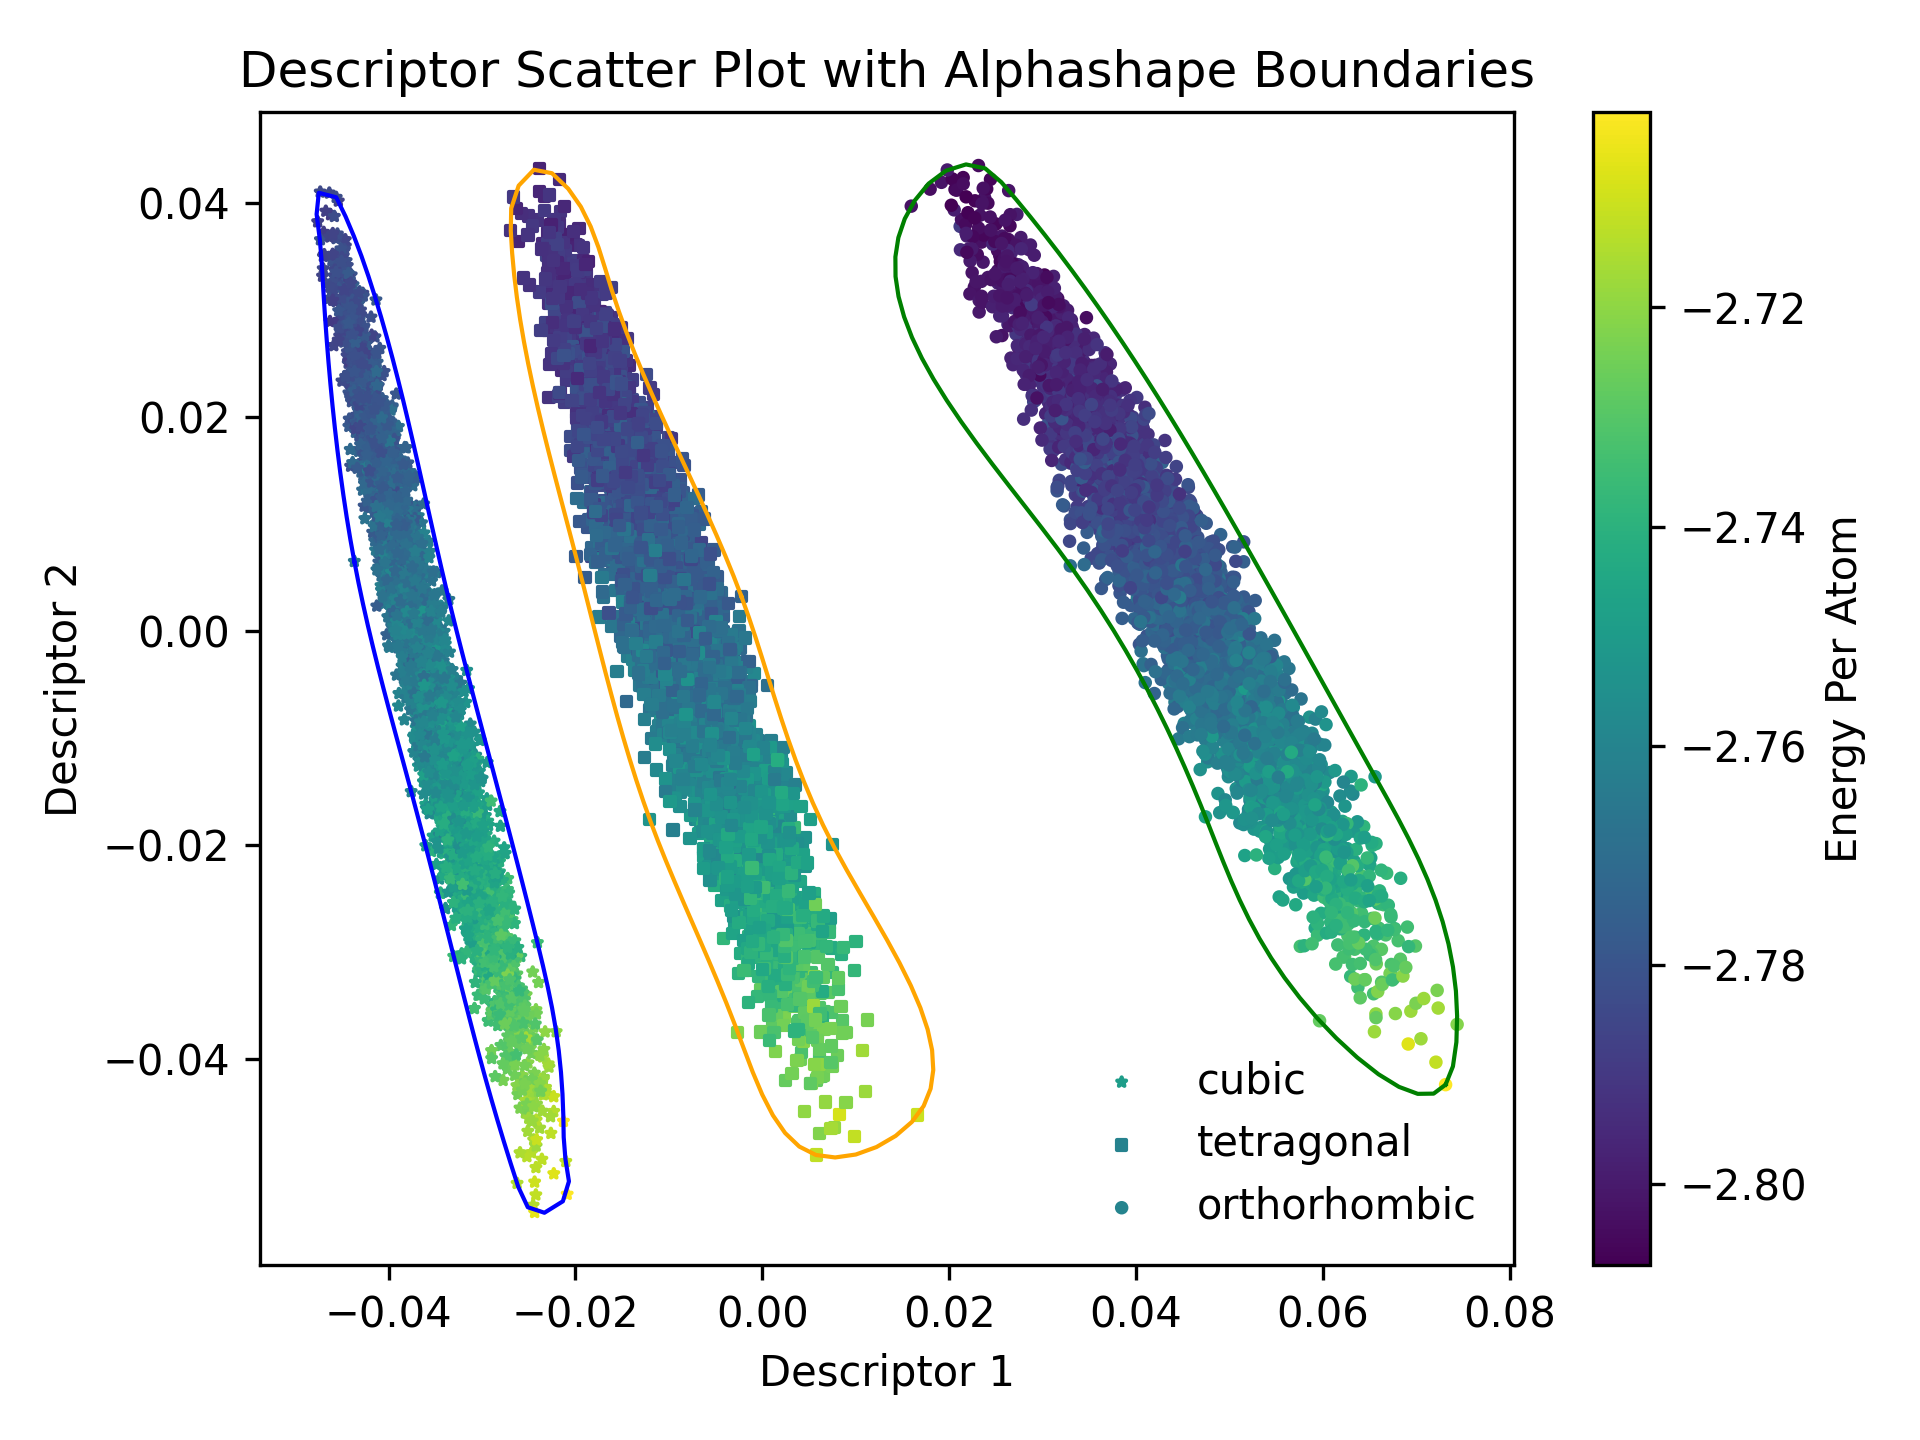
We use CsPbI3 as an example for demonstration. The train.xyz file contains three structures: orthorhombic, tetragonal, and cubic phases. After dimensionality reduction using PCA, the structural distribution of these three phases can be clearly distinguished, as shown in the figure below.
Export Descriptors
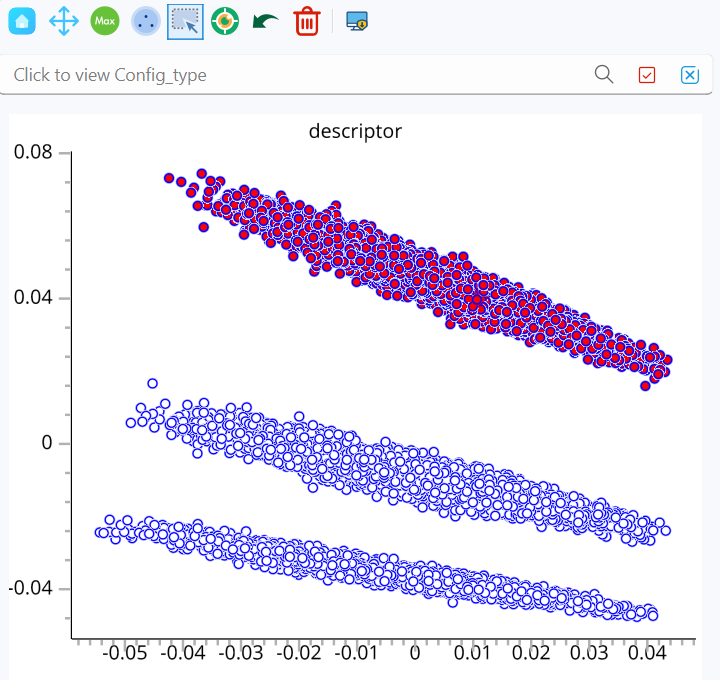
First, use the mouse selection tool
 to select the structures you want to export.
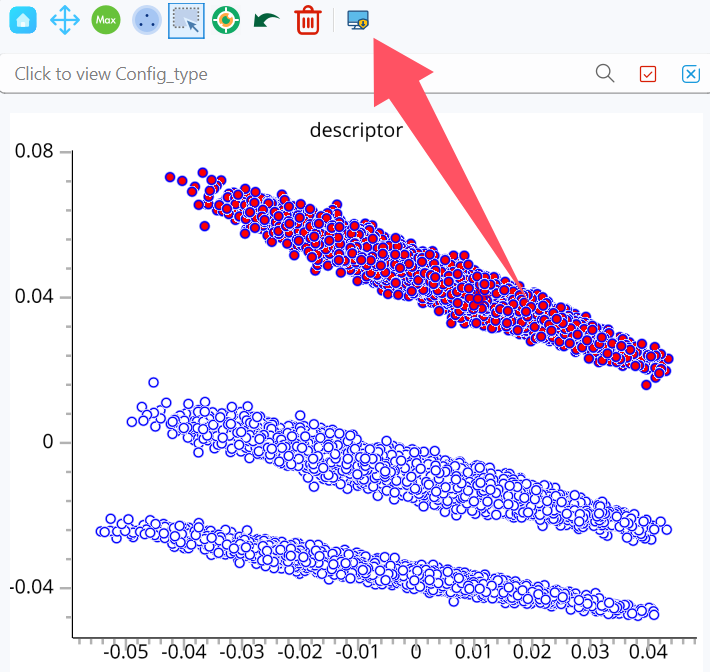
Then, click the export descriptor button
 .
.
Finally, select the export file path to complete the export.
Repeat steps 1-3 to obtain three files: cubic_descriptor.out, orthorhombic_descriptor.out, and tetragonal_descriptor.out.
Plotting the Distribution
We use the plot_descriptor.py script to plot the distribution. Below is a portion of the script where we need to modify the config variable paths and the method variable.
The file paths in config should match the exported file paths. The method variable is used to select the algorithm, which can be either 'alphashape' or 'dbscan'. This algorithm only involves the calculation of the outer boundary.
method = 'alphashape'

if method == 'alphashape':
    import alphashape
else:
    from sklearn.cluster import DBSCAN
    from scipy.spatial import ConvexHull

start_time = time.time()

config = [
    # (Descriptor path, Legend label, Marker symbol)
    ("./cubic_descriptor.out", "cubic", "*"),
    ("./tetragonal_descriptor.out", "tetragonal", "s"),
    ("./orthorhombic_descriptor.out", "orthorhombic", "o")
]
After making the modifications, execute the command python plot_descriptor.py to generate the structural distribution plot descriptor_scatter_plot.png.