From overall composition to numerical distributions
When opening an unfamiliar training set, first ask which element combinations it contains and whether important physical quantities have coverage gaps or abnormal tails. Training Set Audit in the main toolbar provides the overall composition and evidence overview, while Explore distributions expands individual numerical fields.
Start with the complete training set
After loading data, click Training Set Audit in the main toolbar. The overview shows structure, atom, and element counts together with label availability, and uses an element co-occurrence matrix to summarize unary, binary, and multicomponent coverage.
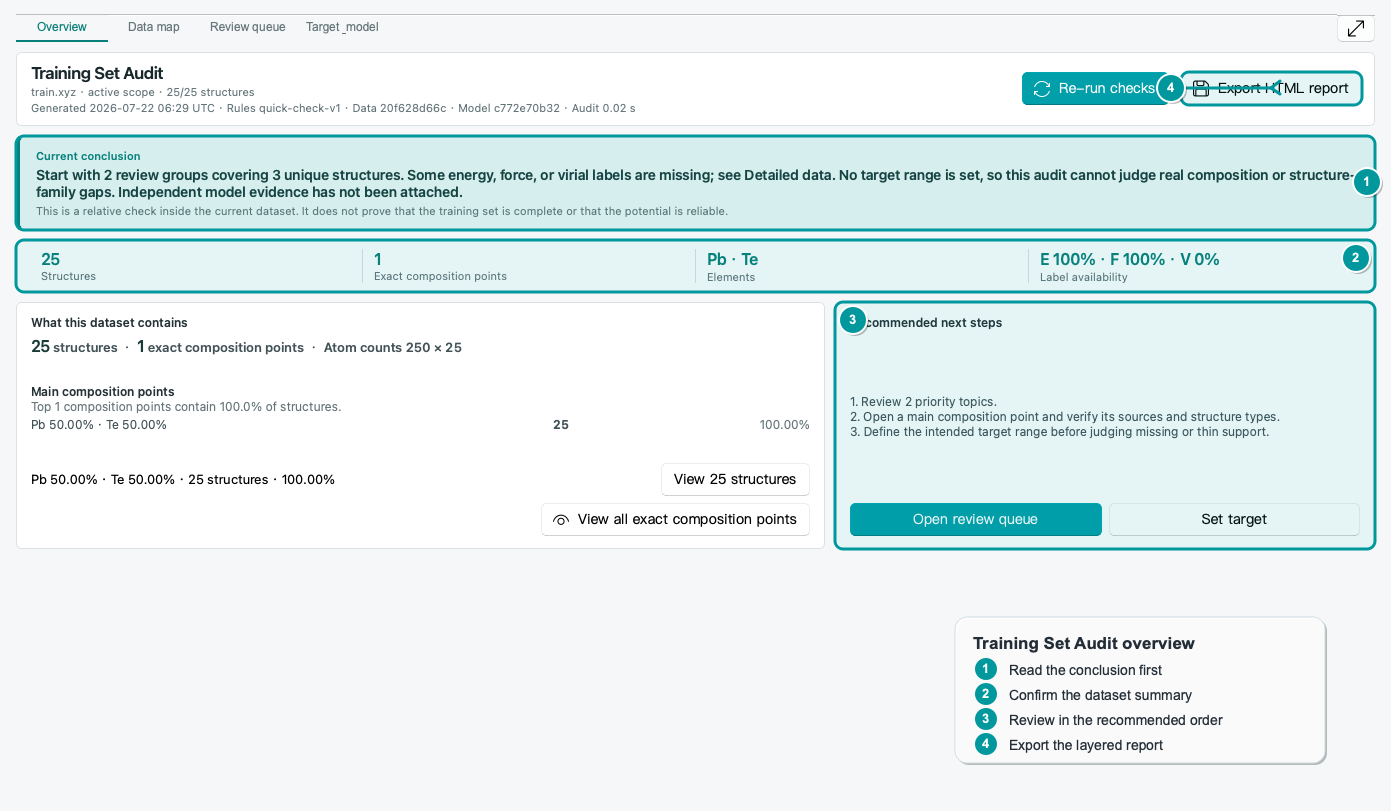
Off-diagonal matrix cells show how often two elements occur in the same structure; diagonal cells represent single-element structures. Clicking an element focuses the related combinations, making rare or missing combinations easier to spot. The element-set table retains exact combinations and shares for verification.
This page replaces the former Dataset summary dialog. Overall statistics, element combinations, and follow-up evidence now live in one place instead of a separate summary under the Save menu.
Inspect Forces and Other Key Fields
Return to Dataset Display, open Explore distributions, and choose a field, scope, and grouping mode. This example inspects force, groups by element, and uses force magnitude on the x-axis:
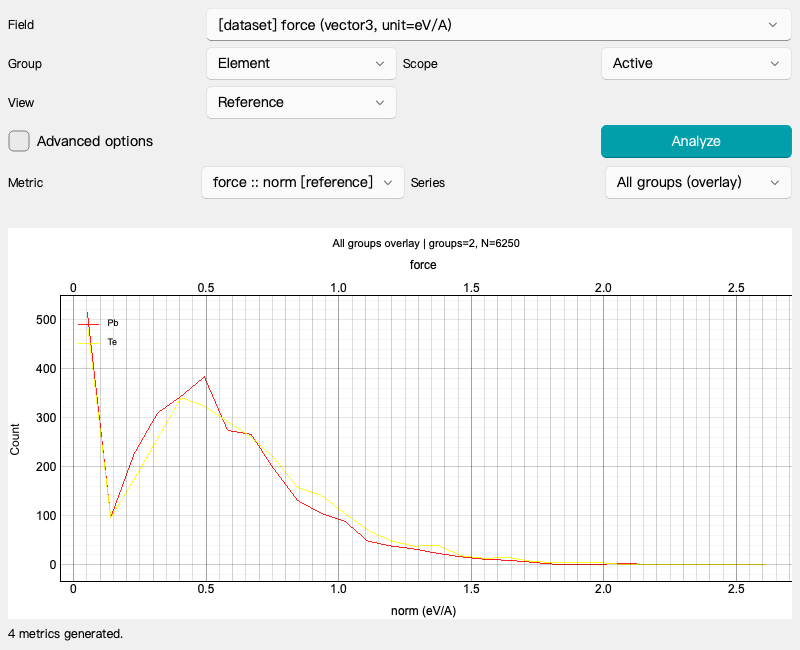
The distribution chart compares coverage across elements or labels. Switch among reference, prediction, and error views to inspect energy, stress, magnetic force, and other fields in the same way.
The overview reveals which combinations exist or are missing; numerical distributions reveal whether label coverage is balanced. After finding isolated spikes, abnormal tails, or shifted groups, return to the main view and inspect the corresponding structures against their geometry and source calculations.